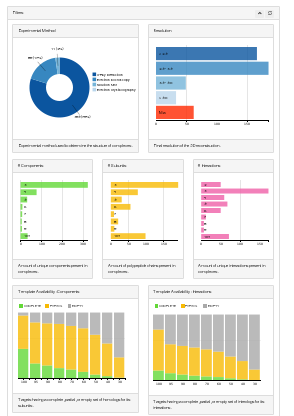
DynBench3D is a web-based resource that allows the automated generation of benchmark sets, composed of target and template complexes of known 3D structure, through a user friendly interface.
We extract from the Protein Data Bank (PDB) non-redundant heteromeric protein complexes composed by at least three unique components. Redundancy is defined by tunable parameters accounting for sequence similarity and structural overlap between complexes. Non-redundant complexes can serve as reference for the evaluation of modelling approaches and are complemented with available homologous unbound subcomplexes at different range of sequence identities.
DynBench3D provides interactive access to benchmarks allowing:
- dynamic selection of redundancy parameters,
- intuitive filtering of target structures and
- the possibility to inspect each individual target and its relationship with identified templates.
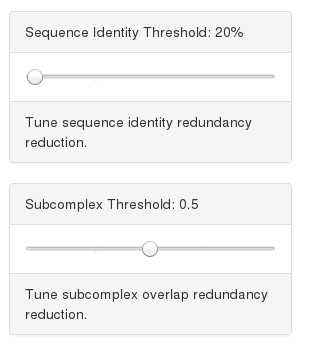
Users can tune redundancy parameters by using the threshold sliders. Sequence identity threshold define the level of hierarchical clustering considered in defining the uniqueness of a complex. Subcomplex threshold is the maximal fraction of shared subunit allowed between targets.
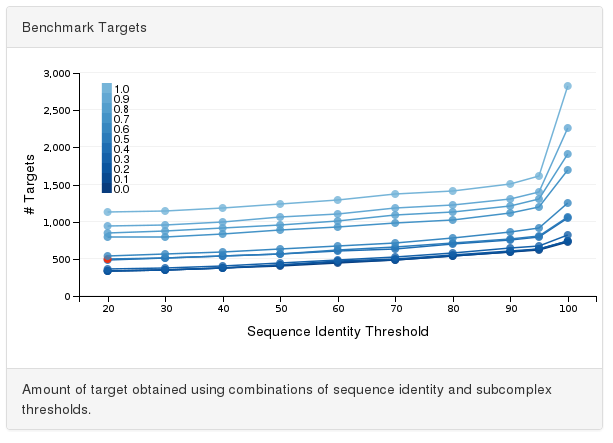
Alternatively, the user can directly select a point from the interactive benchmark chart. This chart reports the number of targets (y-axis) identified using a combination of parameters for sequence identity (x-axis) and subcomplex overlap (color gradient).
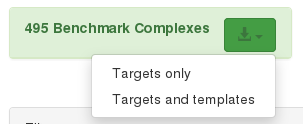
In the download panel the amount of selected targets is visualized and can be downloaded by clicking the download icon. Users have the possibility to download the list of target or the targets along with the identified set of templates.
Targets can be filtered interactively through the charts available in the filter panel. Filtering criteria cover different aspects of the target complex and the corresponding template subcomplexes.
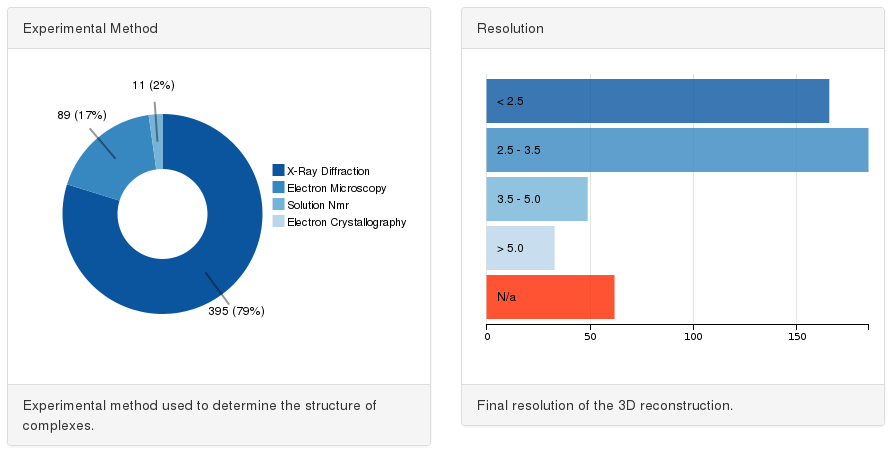
Selecting representative target complexes we favored high resolutions structures, mostly determined by X-ray crystallography. However, since the goal of some approaches to model large complexes might not be to reach atomic details (i.e. hybrid methods), we also retained lower resolution complexes which provide information of the global shape of the complex and the relative orientation of their subunits.
The experimental method chart (pie chart on the left) lets users filter targets depending on their structural determination technique and the resolution chart (bar chart on the right) lets users select the resolution of the target complex.
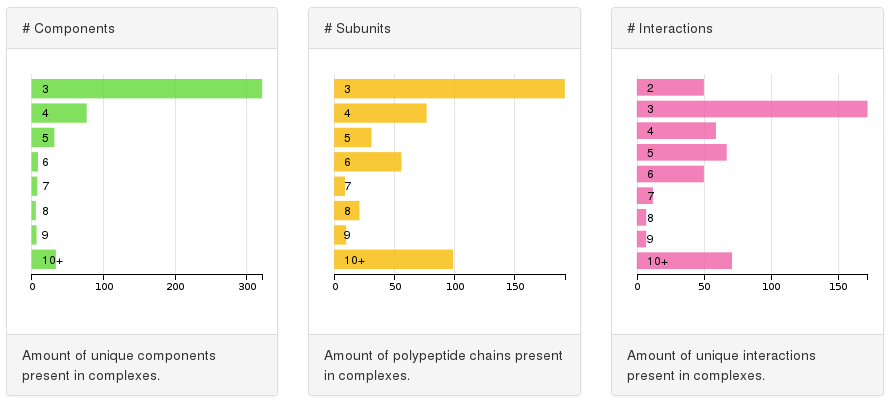
The targets identified represent a collection of different architectural features. We let the user filter targets depending on: the number of components (bar chart on the left), so amount of unique polypeptides according to selected sequence redundancy threshold; the number of subunits (bar chart in the middle), that is the total amount of polypeptide chains in the structure; the number of unique interactions (bar chart on the right) so the direct physical interaction between components.
We also consider the benchmark targets from a structure prediction perspective, analyzing the availability of templates to model their constituent components and internal connections. As expected, the more stringent we are in the sequence identity criteria, the fewer templates we identity to model a given complex, and the same is true for interaction interfaces within complexes. Targets with partial or complete set of templates are ideal for benchmarking integrated homology and docking approaches, while those targets with limited templates are better suited for ab initio modelling.
The availability of templates chart (bar chart on the left) reports the fraction of targets (y-axis) having a complete, partial or empty set of homologous subcomplexes covering components of the target complex. This is analyzed filtering templates by minimal template sequence identity (x-axis) so removing templates without components having lower sequence identities. The same is reported considering direct interactions in the availability of interaction chart (bar chart on the right).

At the bottom of the page we present the list of currently selected targets. The list is sortable on the different features analyzed. Clicking any of the listed targets it is possible to access the target inspection page.
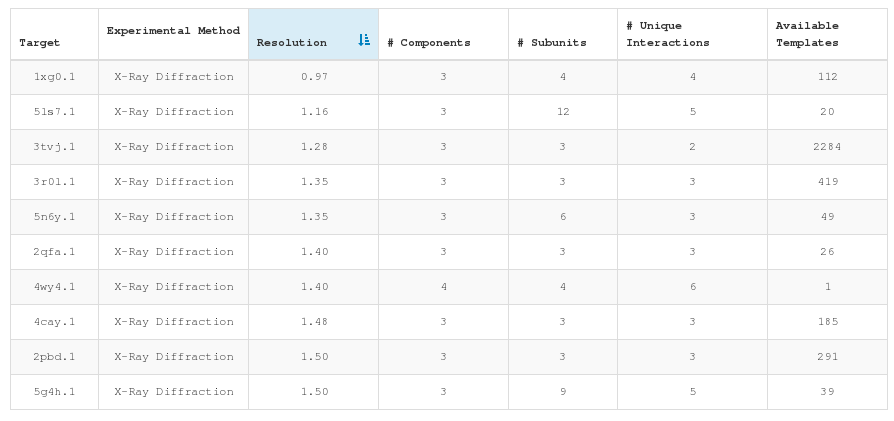
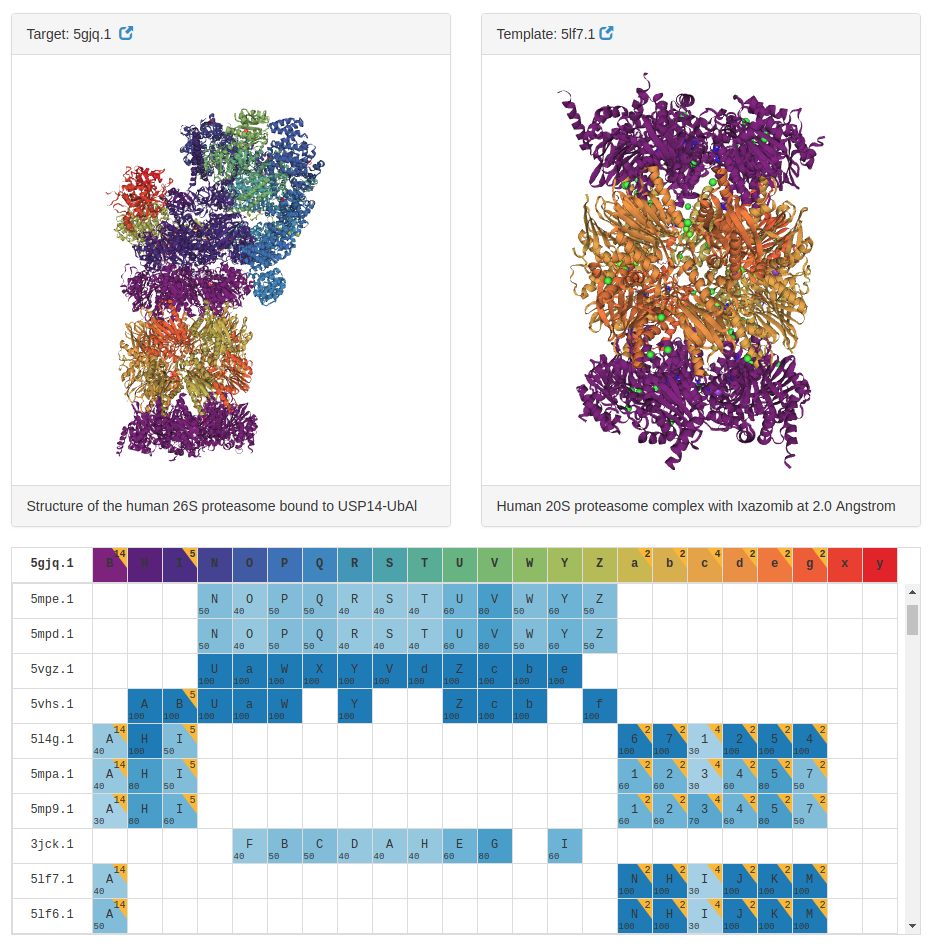
The individual target inspection page lists all identified templates, highlighting the mapping between target chains (columns) and templates (rows). When a relationship between a target and a template chain is found the corresponding cell in the table is annotated with the template chain name, the number of identical subunits and the detected sequence identity.
Two 3D viewers allow the side-by-side inspection of target structure along with a selected template from the list, and the polypeptide chains in target and template complexes are represented with matching colors, enabling an intuitive scrutiny of the chain mapping.